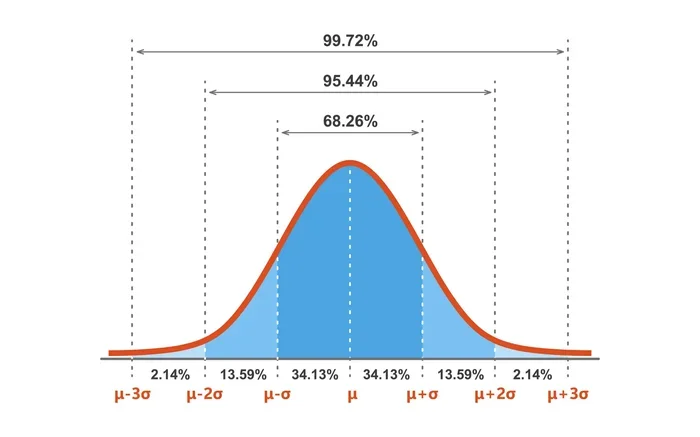

The standard deviation meaning is a measure of how spread out numbers are from their average. It tells you whether data points are close together or scattered far apart. Understanding this concept helps you make better decisions in finance, science, and daily life.
Key Takeaways
- Standard deviation measures how far data points spread from the mean. It is one of the most important tools in statistics.
- A low standard deviation means values cluster near the average. A high standard deviation means values are more spread out.
- You can calculate standard deviation by hand or use a standard deviation calculator. The formula involves finding the variance first.
- Standard deviation plays a big role in finance, quality control, and research. It helps measure risk and consistency.
- Standard deviation vs variance matters because they measure dispersion differently. Standard deviation is in the same units as the data.
- Real-world examples make standard deviation easy to understand. From test scores to stock prices, it applies everywhere.
📑 Table of Contents
- What Is Standard Deviation Meaning? A Simple Breakdown
- Understanding Data Dispersion and Variability
- Standard Deviation Formula Made Easy
- Standard Deviation vs Variance: What Is the Difference?
- Standard Deviation in Real Life: Practical Examples
- Common Mistakes When Interpreting Standard Deviation
- Quick Tips for Mastering Standard Deviation
- How Standard Deviation Builds Topical Authority in Data Literacy
- The Bottom Line: Why You Should Care About Standard Deviation
What Is Standard Deviation Meaning? A Simple Breakdown
Have you ever looked at a set of numbers and wondered how “typical” they really are? You might know the average. But the average alone does not tell the whole story. That is where the standard deviation meaning comes in.
In plain English, standard deviation meaning is a way to measure how spread out a group of numbers is. If all the numbers are close to the average, the standard deviation is small. If the numbers are all over the place, the standard deviation is large.
Think of it like this. Imagine two classrooms of students taking the same test. Both classes have an average score of 75. But in one class, most students scored between 70 and 80. In the other class, some students scored 95 and others scored 40. The standard deviation captures this difference perfectly.
Once you grasp the standard deviation meaning, you start seeing it everywhere. It shows up in weather forecasts, sports stats, financial reports, and even your own fitness tracker data. It is a powerful tool that anyone can learn to use.
Why Standard Deviation Matters in Everyday Life
You might think standard deviation is only for scientists or mathematicians. That is not true at all. Standard deviation meaning affects decisions you make every single day. Here are a few reasons why it matters.
- Better decision making. When you understand how spread out data is, you make smarter choices.
- Risk assessment. In finance, standard deviation helps measure how risky an investment might be.
- Quality control. Factories use it to make sure products meet consistent standards.
- Research accuracy. Scientists rely on it to determine whether their results are meaningful.
- Personal insights. You can track your own habits, like sleep patterns or spending, using standard deviation.
As you can see, the standard deviation meaning goes far beyond a math textbook. It is a practical concept with real-world value.
Understanding Data Dispersion and Variability
Before diving into the formula, let us talk about two key ideas: data dispersion and variability. These terms are closely related to the standard deviation meaning.
Data dispersion simply means how spread out your data points are. Variability is another word for the same idea. When numbers vary a lot from each other, we say there is high variability. When numbers are similar, we say there is low variability.
The standard deviation meaning is essentially a number that quantifies this variability. It gives you a single value that describes the spread of your entire dataset.
The Role of the Mean in Standard Deviation
You cannot understand standard deviation meaning without understanding the mean. The mean is the average of all your data points. Standard deviation measures how far each data point is from this mean.
Here is a quick example. Say you have five numbers: 2, 4, 6, 8, and 10. The mean is 6. Now look at how far each number is from 6:
- 2 is 4 away from the mean.
- 4 is 2 away from the mean.
- 6 is 0 away from the mean.
- 8 is 2 away from the mean.
- 10 is 4 away from the mean.
The standard deviation takes all these distances, squares them, averages them, and then takes the square root. The result is a single number that tells you the typical distance of a data point from the mean.
Standard Deviation Formula Made Easy
Many people feel scared when they see the standard deviation formula. But it is not as complicated as it looks. Let us break it down step by step.
Step-by-Step Calculation
Here is how you calculate standard deviation for a sample of data:
- Find the mean. Add up all the numbers and divide by how many numbers you have.
- Subtract the mean from each data point. This gives you the deviation of each point.
- Square each deviation. This removes negative values and emphasizes larger deviations.
- Find the average of the squared deviations. This is called the variance.
- Take the square root of the variance. This gives you the standard deviation.
That is it! The standard deviation meaning is built right into these five steps. Each step has a purpose, and none of them are random.
Standard Deviation Symbol
You will often see the standard deviation symbol written as the Greek letter sigma (σ) for population data. For sample data, it is written as “s.” The standard deviation symbol is important because it lets you quickly identify standard deviation in equations and textbooks.
If you do not want to calculate by hand, you can use a standard deviation calculator. These tools are free and available online. They save you time and reduce the chance of making a calculation error.
Standard Deviation vs Variance: What Is the Difference?
People often confuse standard deviation vs variance. They are related, but they are not the same thing. Understanding the difference is key to fully grasping the standard deviation meaning.
Variance is the average of the squared deviations from the mean. Standard deviation is the square root of the variance. Why does this matter? Because variance is in squared units, which can be hard to interpret. Standard deviation is in the same units as your original data.
For example, if you are measuring heights in inches, the variance would be in square inches. That does not make intuitive sense. The standard deviation would be in inches, which is easy to understand. This is one of the main reasons we prefer standard deviation over variance in most real-world situations.
| Feature | Variance | Standard Deviation |
|---|---|---|
| Units | Squared units | Same units as data |
| Interpretation | Harder to understand | Easy to understand |
| Calculation | Average of squared deviations | Square root of variance |
| Use in finance | Less common | Very common |
| Use in research | Common in formulas | Common in reports |
When you look at the standard deviation meaning side by side with variance, the advantage becomes clear. Standard deviation gives you a number that directly relates to your data.
Standard Deviation in Real Life: Practical Examples
The standard deviation meaning becomes much clearer when you see it in action. Let us explore some practical examples from different fields.
Standard Deviation in Finance
In finance, standard deviation in finance is used to measure investment risk. If a stock has a high standard deviation, its price swings up and down a lot. That means higher risk. If a stock has a low standard deviation, its price is more stable. That means lower risk.
Imagine two investments. Investment A returns an average of 8% per year with a standard deviation of 2%. Investment B also returns an average of 8% per year but has a standard deviation of 15%. Both have the same average return, but Investment B is much riskier. The standard deviation meaning in this context is a measure of volatility and uncertainty.
Standard Deviation in Education
Teachers use standard deviation to understand test scores. If a test has a low standard deviation, most students performed similarly. If the standard deviation is high, there is a wide range of performance levels. This helps educators identify whether their teaching methods are working consistently across all students.
Standard Deviation in Weather
Meteorologists use standard deviation to compare climate patterns. Two cities might have the same average temperature, but one might have a much higher standard deviation. This tells you that city experiences more extreme temperature swings throughout the year.
Standard Deviation in Sports
Sports analysts use standard deviation to compare player performance. A basketball player with a high scoring average but also a high standard deviation is inconsistent. A player with a similar average but a low standard deviation is more reliable. The standard deviation meaning here is a measure of consistency.
Common Mistakes When Interpreting Standard Deviation
Even smart people make mistakes when working with standard deviation. Here are some common errors to avoid.
Confusing Standard Deviation with Standard Error
Standard error and standard deviation are not the same thing. Standard deviation describes the spread of individual data points. Standard error describes the uncertainty in an estimate of the mean. Mixing these up can lead to wrong conclusions about your data.
Ignoring Outliers
Outliers are data points that are very far from the rest. They can dramatically increase the standard deviation. Always check for outliers before drawing conclusions from your data. A single extreme value can change the entire picture.
Assuming Normal Distribution
Many people assume their data follows a normal distribution, also known as a bell curve. But not all data is normally distributed. If your data is skewed or has multiple peaks, standard deviation alone may not give you the full picture. Always visualize your data with a chart or graph first.
Using Population vs Sample Formulas Interchangeably
There is a slight difference between the formula for population standard deviation and sample standard deviation. Using the wrong one can give you slightly incorrect results. As a rule of thumb, use the sample formula when your data is a subset of a larger group.
Quick Tips for Mastering Standard Deviation
Want to get better at understanding and using standard deviation? Here are some quick tips that actually work.
- Start with small datasets. Practice with just 5 to 10 numbers before tackling larger sets.
- Use visuals. Plot your data on a graph. You will see the spread much more clearly.
- Use a standard deviation calculator. It saves time and helps you verify your hand calculations.
- Always check the mean first. The mean is the anchor that standard deviation measures distance from.
- Practice with real data. Pull numbers from your own life, like monthly expenses or daily step counts.
- Learn the standard deviation symbol. Knowing sigma and s helps you read statistical reports with confidence.
- Compare standard deviation vs variance regularly. This reinforces your understanding of both concepts.
How Standard Deviation Builds Topical Authority in Data Literacy
Understanding the standard deviation meaning is a foundational skill in data literacy. Data literacy means being able to read, understand, and communicate with data. In today’s world, data is everywhere. From news articles to business reports, numbers drive decisions.
When you know what standard deviation means, you can critically evaluate claims made with data. You can spot when a headline is misleading. You can ask better questions and demand better evidence. This makes you a more informed consumer, employee, and citizen.
Many fields value this skill. Healthcare professionals use it to interpret clinical trial results. Marketers use it to analyze customer behavior. Engineers use it to ensure product quality. The standard deviation meaning is truly a cross-disciplinary concept that opens doors in every industry.
If you want to build your data literacy, start with standard deviation. It is the gateway to understanding more advanced topics like standard error, confidence intervals, and regression analysis. Once you have this foundation, learning new statistical concepts becomes much easier.
The Bottom Line: Why You Should Care About Standard Deviation
The standard deviation meaning is simple at its core. It tells you how much your data varies. Whether you are investing money, analyzing test scores, or studying weather patterns, standard deviation gives you context that the average alone cannot provide.
It is a tool that turns raw numbers into meaningful insights. Once you understand it, you will never look at a set of data the same way again. The spread, the consistency, the risk, the reliability, all of it becomes clear when you know how to interpret standard deviation.
So the next time you encounter a set of numbers, do not just calculate the average. Ask yourself: what is the standard deviation? That one question can transform your understanding and lead to better decisions in every area of your life.
Start small. Practice with real data. Use a standard deviation calculator when needed. And always remember: the standard deviation meaning is simply a measure of spread. Once that clicks, you will have a powerful lens for viewing the world through data.
Frequently Asked Questions
What is the standard deviation meaning in simple words?
The standard deviation meaning is a number that tells you how spread out a group of data points is from their average. A low value means the numbers are close together, while a high value means they are more spread out.
How do you calculate standard deviation?
You find the mean, subtract it from each data point, square the results, average those squared differences to get the variance, and then take the square root of the variance. A standard deviation calculator can do this for you in seconds.
What is the difference between standard deviation and variance?
Variance is the average of the squared deviations from the mean. Standard deviation is the square root of the variance. The key difference is that standard deviation is in the same units as the original data, making it easier to interpret.
Why is standard deviation important in finance?
In finance, standard deviation measures investment risk and volatility. A higher standard deviation means the investment’s returns swing more widely, indicating higher risk. A lower standard deviation suggests more stable and predictable returns.
What does a high standard deviation tell you?
A high standard deviation means the data points are spread out over a wide range. It indicates high variability and less consistency in the dataset. The values are farther from the mean on average.
Can standard deviation be negative?
No, standard deviation can never be negative. Since it involves squaring deviations and taking a square root, the result is always zero or a positive number. A standard deviation of zero means all data points are identical.